

Winans Market Research & Forecasts Since 1991
Ken Winans pioneered the development of several investment indexes and technical indicators. This research has aided Mr. Winans in making timely market forecasts for the firm he founded, Winans Investments, to successfully invest in a variety of economic conditions since 1991.
Stocks Make Bad Pets
They can bite you in bear markets. The FAANG stocks just hammered their loyal, “never sell-em!” investors.

Research Forecast
So far, this year has been a “poster child” for investors who follow the
stock market’s seasonal trends.
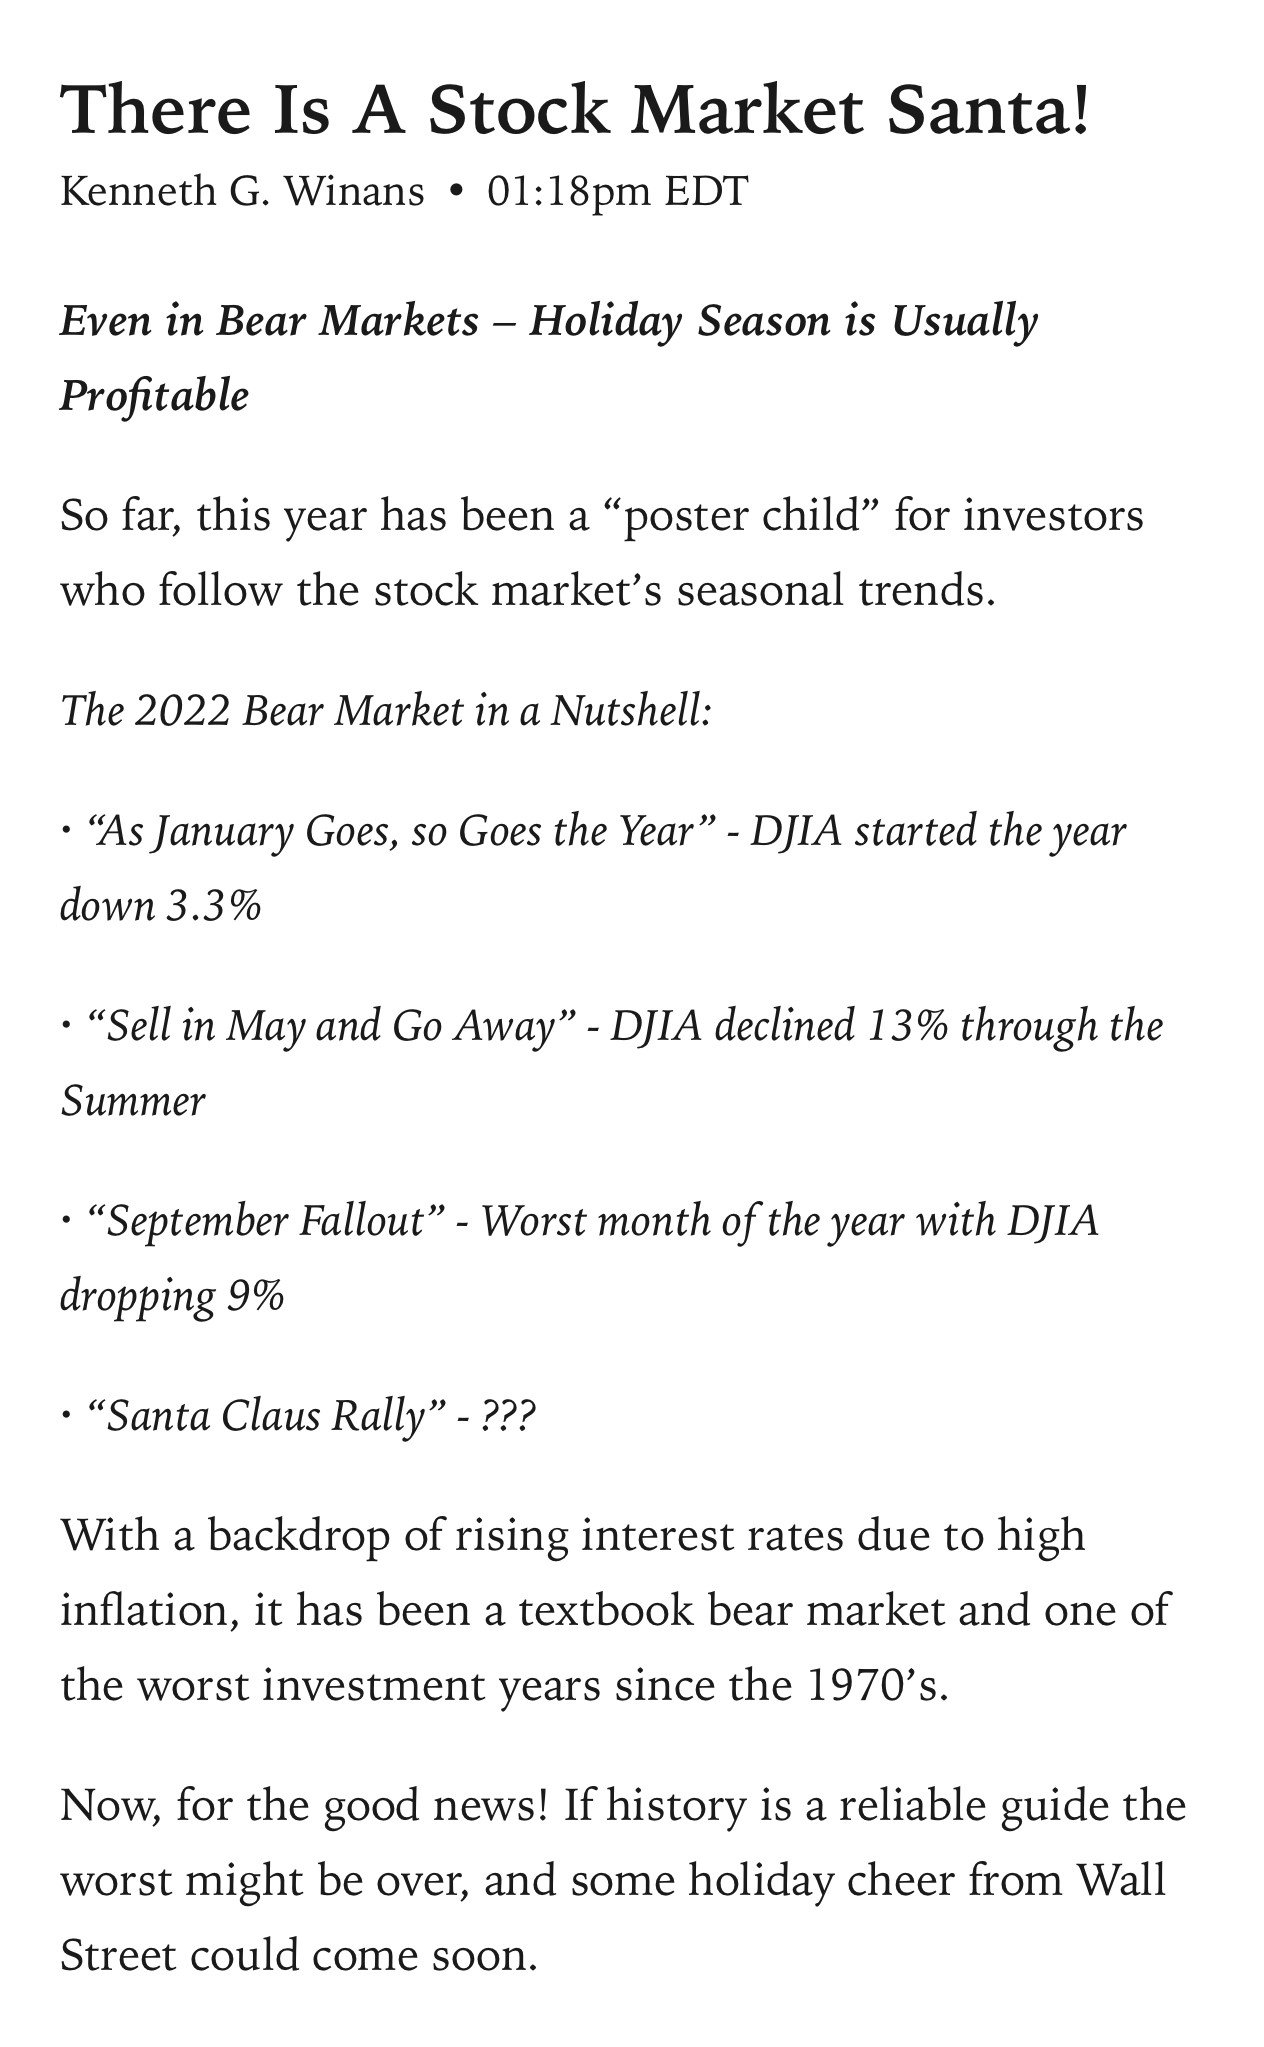
There Is A Stock Market Santa!

The Great Real Estate Tumble of 2022
A 1970’s Type of Housing Market is Possible in Future
It is official! The back-to-back quarterly losses of nearly 18% in the Dow Jones Corporate Bond Average is the third worst six-month period since 1929.

The Great Bond Crash of 2022!

Buy The Dip - Not This Time!
Besides superior long-term performance, stock investing offers many advantages not found in other asset classes..
Every single past generation has gone through serious multi-year stock bear markets where the financial devastation was well remembered with fear and anger.

Bear Market Hunting
Taxes strongly influence investment choices, when profits and losses are realized, and which types of brokerage accounts are used (taxable versus tax-deferred).

Fleece The Golden Geese
As we finish out another volatile year, there must be some serious financial “soul searching” going on right now as many foreign-stock boosters have seen their foreign-stock funds plummet.

Remember the BRIC?
As we wrap up one of the craziest investment years since the 1970’s Oil Embargo, investors are looking for some time-tested guidance. Perhaps next January’s stock market moves can tell us something about the prospects for 2021 being a good or bad year.

Stock Market Seasonality
Do The Winds Of Political Change Really Have An Effect On Investing

Contrary to what the business community believes, not all bull markets are generated on the Republican side. The best investment return for a Democrat was Clinton’s post-cold war eight year tenure of 263%. The 2nd best on record!
December 27, 2016 Winans Special Investment Report
Our 20 time-tested key investment indicators are positive and confirm the current stock market rally has the breadth and trading volume to go significantly higher. While stocks don’t go straight up, we don’t expect pullbacks in 2017 to exceed 7%....With the Trump administration’s ambitious economic agenda, U.S. common stocks should greatly outperform income investments and could achieve annual returns not seen since 1990’s (In fact, the S&P 500 Index had average annual returns of 19% from 1992-1999!).”

October 29, 2015 - Forbes.com Article.
“Then came the [August] collapse of 2015. It was worse, so I got busy reducing equities exposure for clients early in the selloff….I’m not entirely convinced this bear market is over, but the major stock indexes are slightly above their 200-day average again, so I’m selectively buying equities for clients again. On a risk-adjusted basis, they will have outperformed all-stock buy-and-holders.”
Facts: S&P 500 Index continued trading in a 13% sideways channel until the presidential election in November 2016. As of December 30, 2016 most market indices reached record levels and are 9% higher since this report.
Fourth Quarter 2014 Winans Client Newsletter
“Similar to late-stage equity bull markets of the past, volatility has increased and unhealthy divergences are occurring within the various segments of the U.S. stock universe. Last October, most of the U.S. market indices were in negative territory with most of the 2014’s profit was made in November. Wide performance variances also occurred in individual stocks. Every day, we track 90 U.S. stocks that are some of the best long-term performers. In 2014, 30% of these marquee stocks had posted significant declines and many had broken below their 200-day moving averages (versus only 3% in 2013 and 12% in 2012).
Facts: In 2015, most U.S. stock market indices posted their worst year since 2011. The S&P 500 Index posted a -15% decline from May 2015 – January 2016.
December 30, 2013 Winans Investment Client Newsletter
This next year will not be a repeat of 2013! Although our intermediate market trend indicators for stocks, corporate bonds and housing are mostly positive, it is not unusual for U.S. common stocks to post a mediocre year following a powerful advance (like the 29% advance in 2013), and lag income investments like corporate bonds, preferred stocks and reits. Keep in mind that the strong stock market results of 2003 and 2009 were followed by volatile markets posting single digit annual returns.
Facts: In 2014, the DJIA and NYSE Composite posted single digits results between 4% - 8% in 2014. The Dow Jones Corporate Bond Average posted an all-time record high with a 9% total return.
October 22, 2013 USA Today Interview
‘“More than 800 stocks trading on the NYSE and the NASDAQ are at their highest levels over the past year. Seeing that many stocks hit 52-week highs at the same time has only happened five other times since 1974, including 1982, 1986, 1997, 2003 and 2010. Each of these periods were followed with powerful rallies.””
Facts: The NYSE Composite & NASDAQ posted strong results or 12% and 33% to May 2015.
December 30, 2012 Winans International Client Letter
“Currently, most of our investment research points to neutral/positive financial environment.”
Facts: From December 31st 2012 to December 31st 2013, the S&P 500 Index increased 30%.
June 19th, 2012 Forbes.com Article
“When yields are low, I prefer bonds with maturities of 10 years or less. It’s tempting to chase the higher yields offered by long-term bonds, but when interest rates inevitably increase, long bonds get hammered.”
Facts: The 30-year yield of Dow Jones Corporate Bond Average Index rose 29% from a low of 4.2% (October 26th, 2012) to multi-year high of 5.41% by August, 23rd 2013.
January 9, 2012 Forbes.com Article
““First, let me explain why I’ve become such a naysayer on foreign-stock ETFs. According to our analysis, foreign stock exchange-traded funds have been a poor hedge against swings in the U.S. stock market, and they’ve been sub-par performers over the past 15 years.””
Facts: Since December, 30 2011, the share price of the MSCI Emerging Markets ETF (EEM) increased 9%. The S&P 500 Index (SPY) has increased 47% during the same timeframe.
December 30, 2011 Winans International Client Letter
“Currently, most of our investment research is pointed to positive market conditions.”
Facts: From October 4th 2011 to December 31st 2012, the S&P 500 Index increased 33%.
September 30, 2011 Winans International Client Letter
““As stated in my latest Forbes.com article, “Our key stock market indicators turned negative on August 5th.” As a result, we took timely defensive action within our individual client portfolios by:
1. Increasing cash levels through trimming large individual stock positions and reducing exposure in individual stocks that violated key technical signals such as the 200-day moving average.
2. Reallocating portfolios to corporate income investments such as preferred stocks and corporate bonds. In fact, The YTD total return of the Winans International Preferred Stock Index (WIPSI) is up 5.5%!
3. Using The Winans Long Short Fund (ETFMX) as a hedging vehicle. In fact, the latest performance figures from Morningstar show ETFMX as having the best performing 12-month return of all mutual funds in the “Moderate Allocation” category.”
Facts: The S&P 500 Index declined 15% from December 30th 2010 to October 4th 2011.
January 28, 2011 PR Newswire
“Some progress has been made toward leaving behind the worst residential real estate bear market in 68 years….It could easily take another year to dry up excess inventory and for mortgage credit to ease.”
Facts: The Winans Real Estate Index reached a multi-year bear market low of 229,300 on October 30, 2010, and has advanced 25% by December 31st, 2013.
May 19, 2010 USA Today Interview
““Historically, gold has been a laggard compared with most other asset classes….By going to 20% or more of your portfolio allocation into gold, as some gold bugs recommend, will likely generate subpar future returns.””
Facts: : Gold made an all-time high $1,895 an oz. on September 6, 2011, then entered a multi-year bear market with a total decline of 37%. The S&P 500 (SPY) increased 59% since September 6, 2011.
October 20, 2009 US Today Interview
“According to historical trading data from Ken Winans. Investors who followed the 200-day moving average buy and sell rules enjoyed larger returns than those who bought and held on between 1988 through fall 2008. This year, the S&P stock index rose above and stayed above its 200-day moving average in July. While investors using the rule missed the bottom, set in March, they were still in early enough to enjoy a big portion of the upside. These investors, it’s important to point out, also missed a lot of the bear market that began in 2007 if they followed the average and sold in early in 2008.”
Facts: The S&P 500 has stayed above its 200-day moving average (i.e., an uptrend) most of the time since 2009.
June 30, 2009 – Winans International Client Letter
“Historically, early bull market rallies post strong returns. In 1975, the S&P 500 advanced 32%, and in 2003 it increased 26%. Both years produced approximately 45% of all of the index’s price appreciation for the following 5 years. We believe that the S&P 500 index will average 9.2% (with dividends) annually over the next 5 years. This is well below the 12.3% total return of the 1980’s & 90’s. The stock market will probably trade sideways with no new highs during this time.”
Facts: The S&P 500 increased 23% in 2009 and was the best performing year until 2013. The average return of the S&P 500 Index between 2008 & 2012 was approximately 13%.
November, 2008 – Financial History Magazine Article
“There are common themes in the 13 major bear markets of the past. Simply put, the names and dates might have changed, but the causes were similar. Good News! In most cases, these dire times were followed by powerful market rallies over the following 12 months, and long before the media’s headlines became bullish…..Even more impressive is that these market rallies have typically extended for two years with an average total return of 44%.”
Facts: From the bear market low of 6,547 on March 9, 2009, the Dow Jones Industrial Average advanced 77% by December 31st, 2010.
January 15, 2008 – Winans International Client Letter
“This report is timely because by most indications, stocks, real estate, bonds and preferred stocks are all currently in bear markets – a rare occurrence!…..The Winans Trend Indicator gave its first negative signal in over five years on 1/4/2008 (S&P 500 Index = 1412). This indicates we are in the early stages of a bear market in U.S. stocks.”
Facts: The Dow Jones Industrial Average declined 51% from the end of 2007 to March 9, 2009.
July 8, 2007 – Investor’s Business Daily
“Daily prices of preferreds started to dip below their 200-day moving averages in late 2006 for the first time in years, in part because of bond market turmoil.”
Facts: From December 31st, 2006 to March 9, 2009 the Winans Preferred Stock Price Index declined 55%, and the Dow Jones Corporate Bond Price Index declined 16%. These were the worst declines in most income investments since the 1930’s.
December 16, 2006 – “Preferreds” Book
“A future correction in income investments could cause even more damage than the bust of the dot-com bubble.”
Facts: From December 31st, 2006 to March 9, 2009 the Winans Preferred Stock Price Index declined 55%, and the Dow Jones Corporate Bond Price Index declined 16%. These were the worst declines in most income investments since the 1930’s.
October 17, 2002 – Winans International Client Letter
“We have just completed extensive research of the stock market over the last 100 years and have reached some telling conclusions: 1. All of the major stock market declines have been less than 2 ½ years. In fact, it has now been 2 ½ years since the S&P 500’s peak in March of 2000. The stock market has had powerful rallies of at least 80% following all major market declines. We think there is a strong possibility of this happening over the next several years as long as interest rates remain low.”
Facts: From the bear market low of 7,423 on October 7, 2002, the Dow Jones Industrial Average advanced 92% by October 11, 2007.
October 16, 2001 – Winans International Client Letter
“During the last 2 ½ years, we have witnessed a combination of events that are without historical comparison: Y2K threat, NASDAQ stock market crash, presidential election mishap, energy shortages and the ongoing terrorist attacks. In fact, these abnormal economic conditions have resulted in the highest level of stock and bond market volatility since the 1970’s….The good news is that our research indicates there is a 75% chance that the U.S. stock market can recover the ground it lost this years within the next 24 months.”
Facts: The Dow Jones Industrial Average made an all-time high of 11,723 on January, 14 2000. This was followed by a multi-year bear market that made a low of 7,423 on October 7, 2002.
December 28, 1999 - Forbes.com Interview
“Worried about the 82% gain in the Nasdaq Composite Index and inflated tech stocks? Money manager Ken Winans is….Unless the market’s broaden out form here—that is, investors start moving to stocks other than technology names—things could get tough in 2000.”
The Dow Jones Industrial Average made a record high of 11,723 on January, 14 2000. This was followed by a multi-year bear market that made a low of 7,423 on October 7, 2002.
September 8, 1999 Winans International Client Letter
“Although I am surprised that the damage to the S&P 500 Index has been minimal so far, I am concerned about the immediate future for the stock market due to: 1. Continued weakness in the broader (non-tech) market, 2. Continued increases in interest rates and 3. The effect that Y2K related problems in foreign countries could have on the US economy….I firmly believe that until conditions begin to improve or the market provides a buying opportunity, investors should err on the side of caution.”
Facts: The Dow Jones Industrial Average made a record high of 11,723 on January, 14 2000. This was followed by a multi-year bear market that made a low of 7,423 on October 7, 2002.
May 17, 1999 The Wall Street Transcript Interview
“Clearly there is an increase in the volatility of the market in percentage terms. And I do not believe that this is going to subside anytime soon…It would not surprise me to see the DJIA back around 8,000 at some point in time between now and end of 2001…I firmly believe we’ll see the Dow hit 14,000 between now and the year 2007. But it’s not going straight up. We will have some years that get pretty ugly.”
Facts: The Dow Jones Industrial Average made a bear market low of 7,423 on October 7, 2002. The Dow Jones Industrial Average closed above 14,000 for the first time on October 5th, 2007.
September 4, 1998 Winans International Client Letter
“Even though the global economy has slowed down this year, I don’t believe it will “sink” into a recession due to the strength of the domestic economy and low interest rates. In light of this, I have started buying stocks and bonds that are expected to post sound earnings over the next twelve months.”
Facts: The Dow Jones Industrial Average increased 53% from September, 1998 to January, 2000.
February 15, 1998 - Winans Portfolio Monitor Newsletter
“The S&P 500 is trading within a 15% upward sloping channel established in 1995. The index is currently near resistance at 1040. Any correction to the 960-930 range is a buying opportunity.”
Facts: The S&P 500 Index reached 1187 on July 17th, 1998, then declined to 959 on October 8th, 1998.
September 29, 1997 The Wall Street Transcript Interview
“I have believed for a long time that the U.S. is in the midst of a post-cold war economic expansion…in 1989 the Cold War ended, the Soviet Union ceased to exist as a nation, and the U.S. economy demonstrated similar characteristics that it did after both world wars…a strong bull market for U.S. investments. If I’m correct, this economic expansion could go on for another seven to ten years as evidenced by “The Roaring 20’s after WWI and “The Golden Era” after WWII. In both cases, the DJIA had increased over 400 percent, which, if we put it in today’s terms, would mean the Dow at 14,000 by the year 2007.”
Facts: The Dow Jones Industrial Average closed above 14,000 for the first time on October 5th, 2007.
September 30, 1994 - Winans Portfolio Monitor Newsletter
With the exception of the Iraq War, the S&P 500 Index has been trading in an upward trending channel since early 1990. It is currently 2% above strong support. A buying opportunity exists today, while the index is in the 452 to 460 range.
Facts: The S&P 500 stayed above its 200-day moving average (i.e., an uptrend) throughout much of the 1990s. There were minor corrections in 1994 and 1996.
May 30, 1991 - Winans Portfolio Monitor Newsletter
“The S&P 500 broke through the top of a four-year trading channel at 378 and the investment model has moved from buy to neutral. Investors should buy technically strong companies as long as the market stays above 380. This is a BULL market while the S&P 500 stays above its 200-day moving average at 340.”
Facts: The S&P 500 stayed above its 200-day moving average (i.e., an uptrend) throughout much of the 1990s. There were minor corrections in 1994 and 1996.
Disclaimers
This content is for informational and educational purposes only, and should not be considered investment advice.
Past performance should not be taken as representative of future results.
While the selected text is considered accurate, Ken Winans and Winans Investments does not guarantee these quotes relates to all topics & opinions covered in these articles. Copies of the entire articles & client letters mentioned above are available upon requests.
These selections represent a small sample of all research and third party interviews done by Kenneth G. Winans and/or Winans Investments since 1991. Other research reports or third party interviews might offer different opinions than represented in the selected articles.
Additional information is available upon request at WinansInvestments.com.